

Hey folks! A small birthday request before we start. Word of mouth is basically the only way Hypertextual gets new subscribers. If you enjoy it, please forward this email to one person who might like it. And if somebody forwarded it to you, you can subscribe here.
One more thing: if you’ve been reading Hypertextual for a while, hit reply and introduce yourself. Who are you? Where are you? What do you do? I see the subscriber number, but I know a few of the people behind it. I’d love to change that.
Now, the birthday.
I turned 43 today. Naturally, I made a data visualisation. I was born in 1983, so I looked at what 43 years did to London.
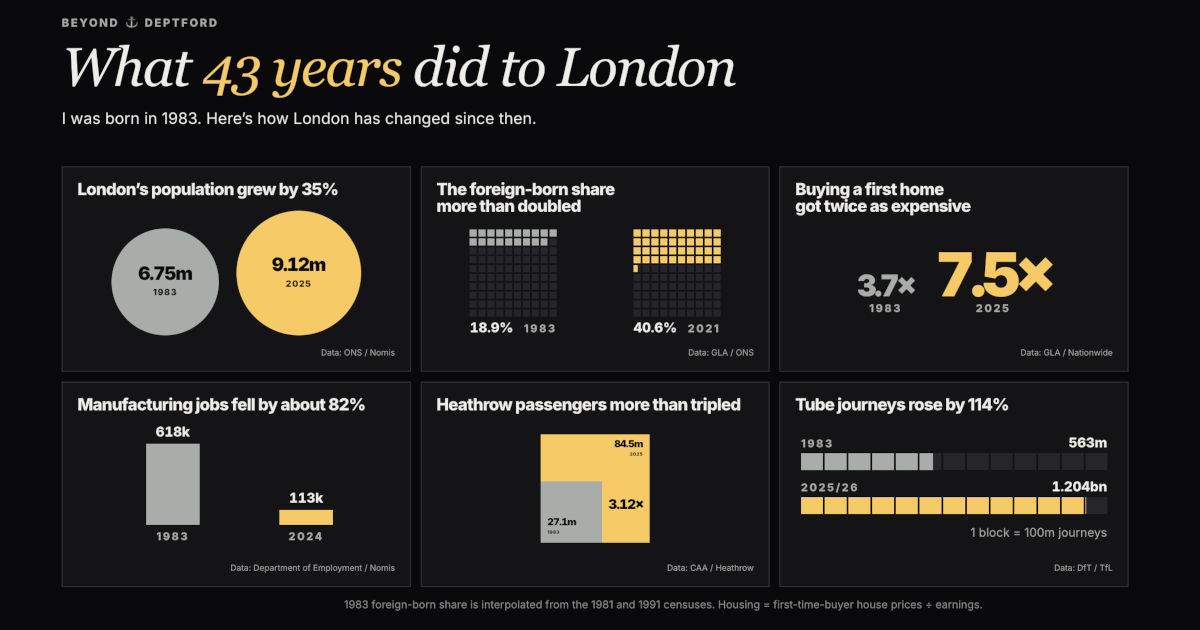
London’s population has grown by 35%. The share of Londoners born abroad has more than doubled. Heathrow handles more than three times as many passengers, while Tube journeys are up 114%. Buying a first home relative to earnings is about twice as expensive. Manufacturing employment has fallen by roughly 82%.
Six numbers cannot explain 43 years of a city, obviously. But putting them side by side gives a snapshot of just how different London was when I arrived in the world.
Continuing my data visualisation journey
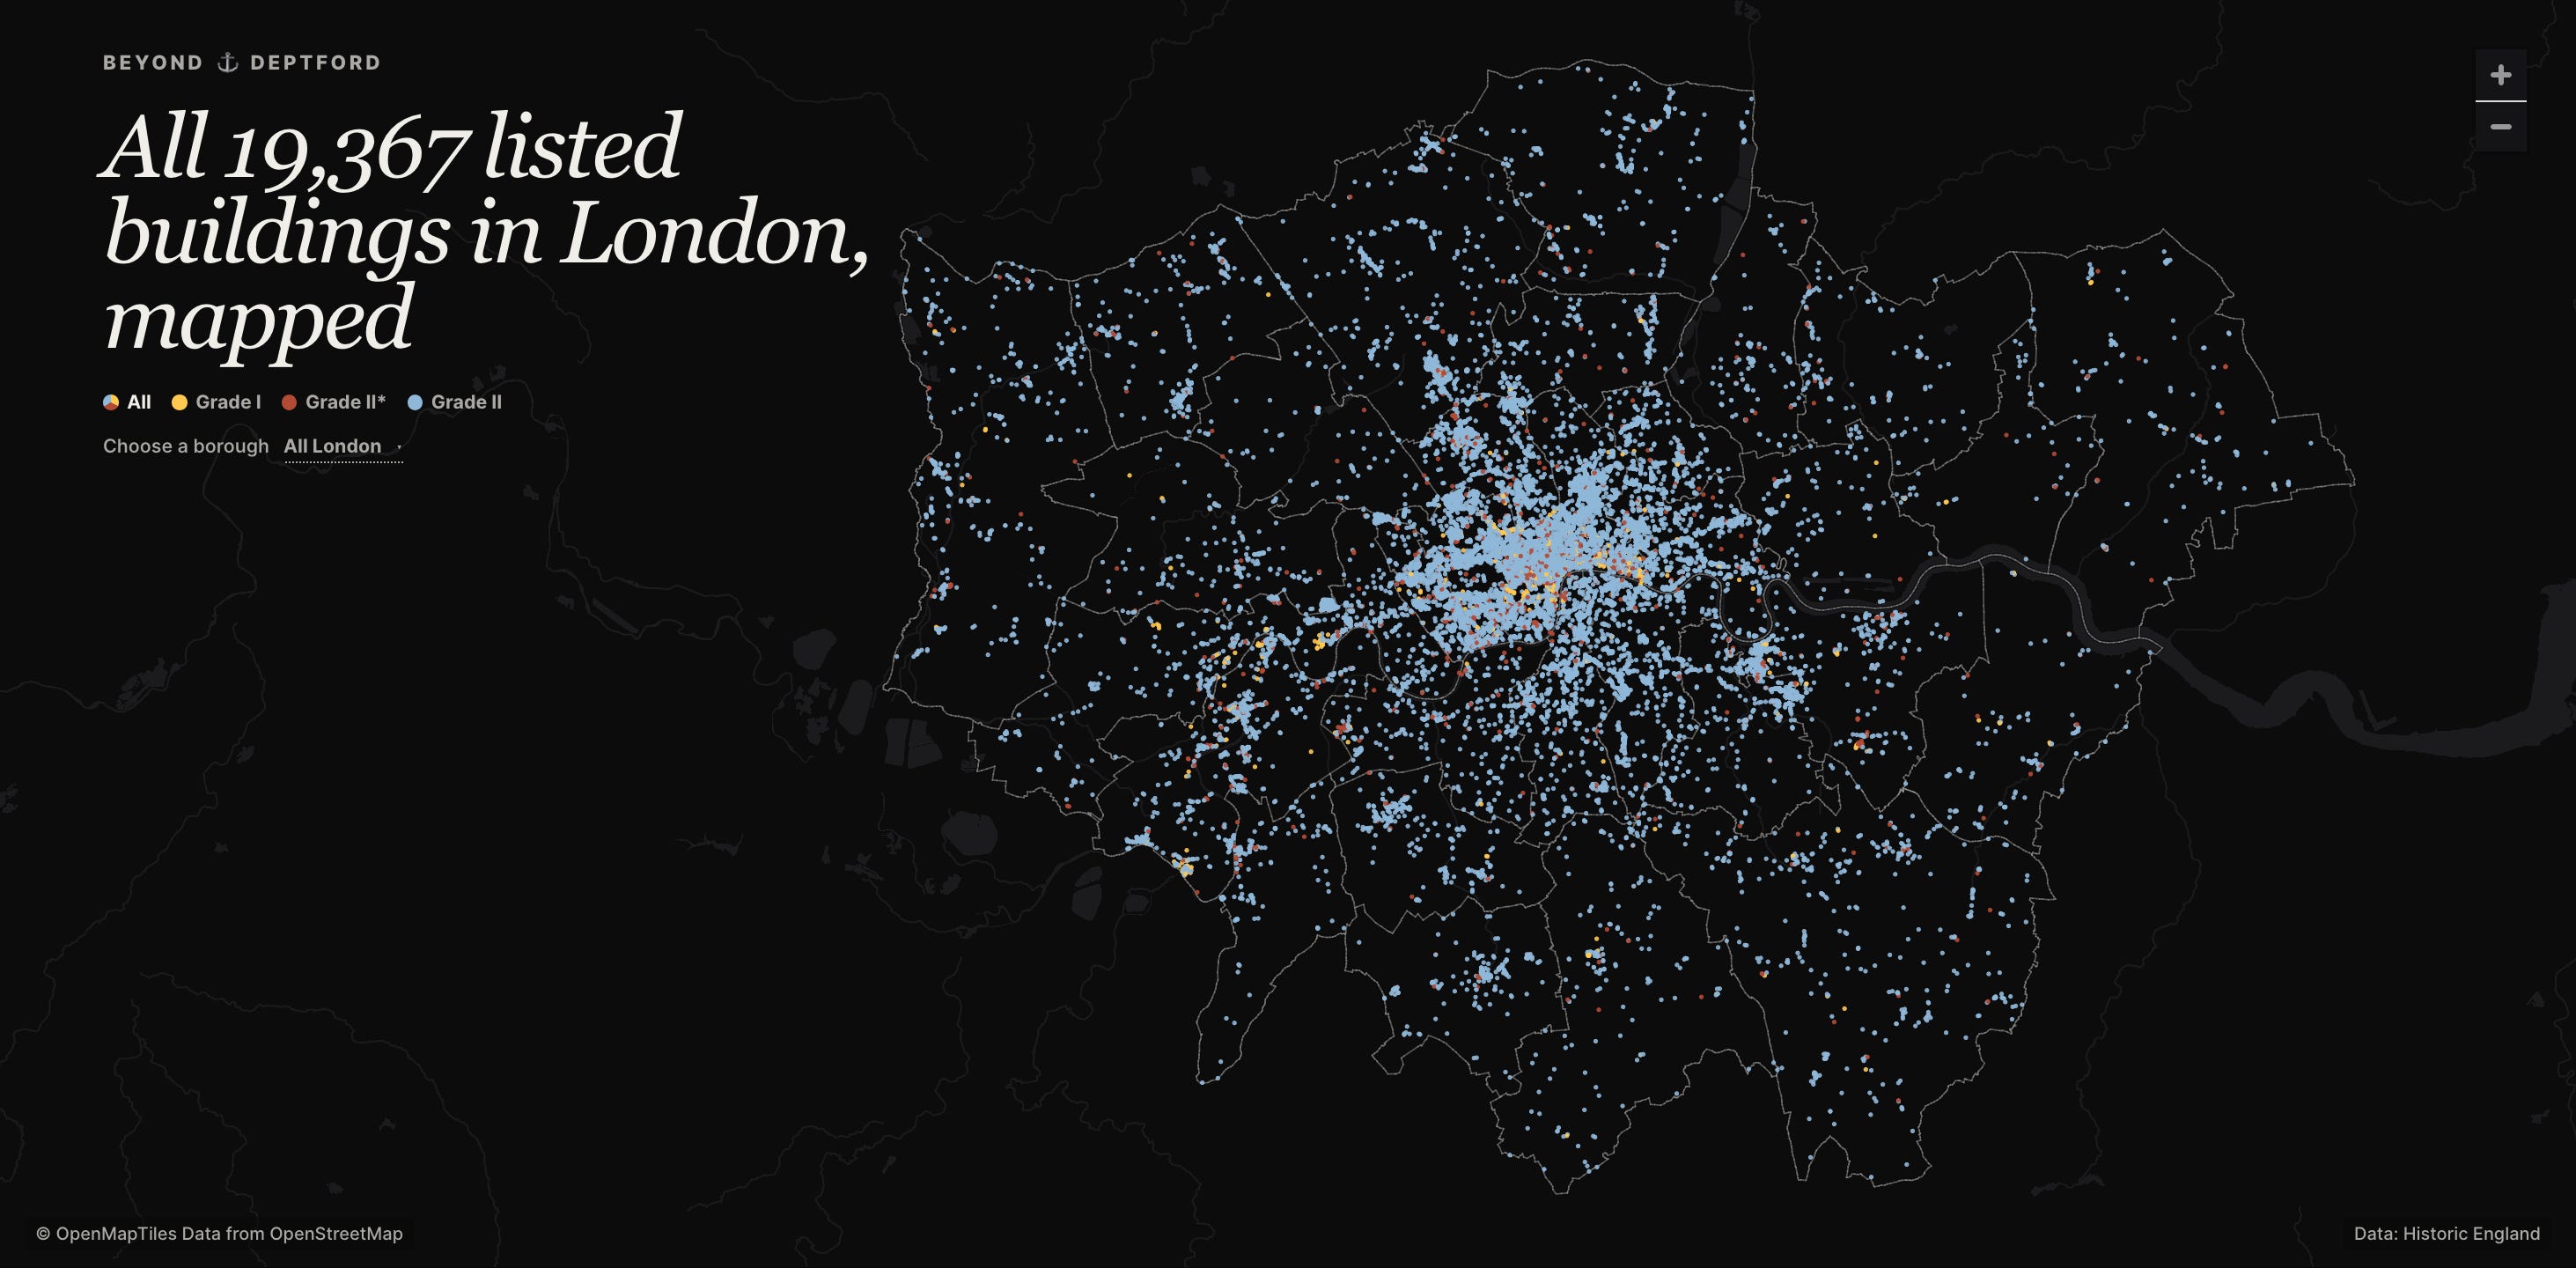
This summer, I finally started making my own dataviz projects. Then I decided to make one London data visualisation every day in September. For example, I mapped all 19,367 listed-building entries in London. Westminster alone has 4,003, more than the 18 boroughs with the fewest listed buildings combined.
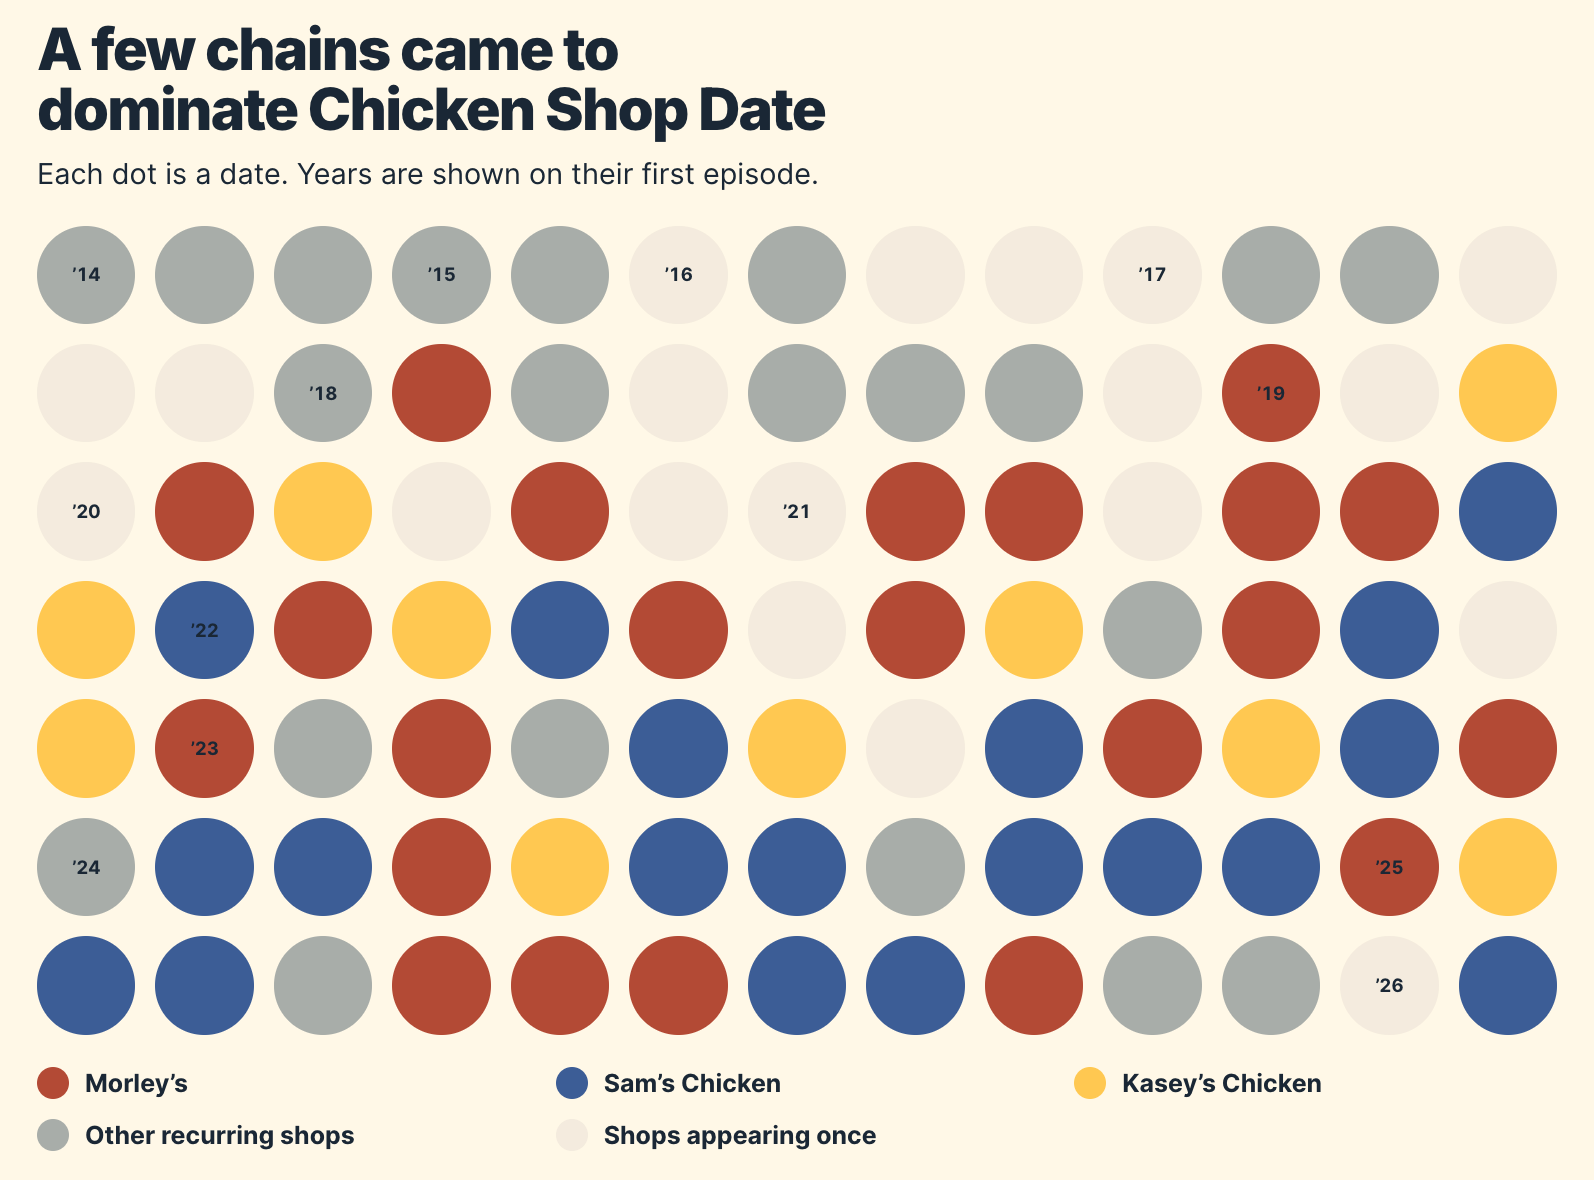
For 12 years of Chicken Shop Date, mapped, there was no ready-made dataset. I started with a fan-compiled list, checked it against the videos and filled in the gaps. I eventually mapped 91 London episodes across 43 locations.
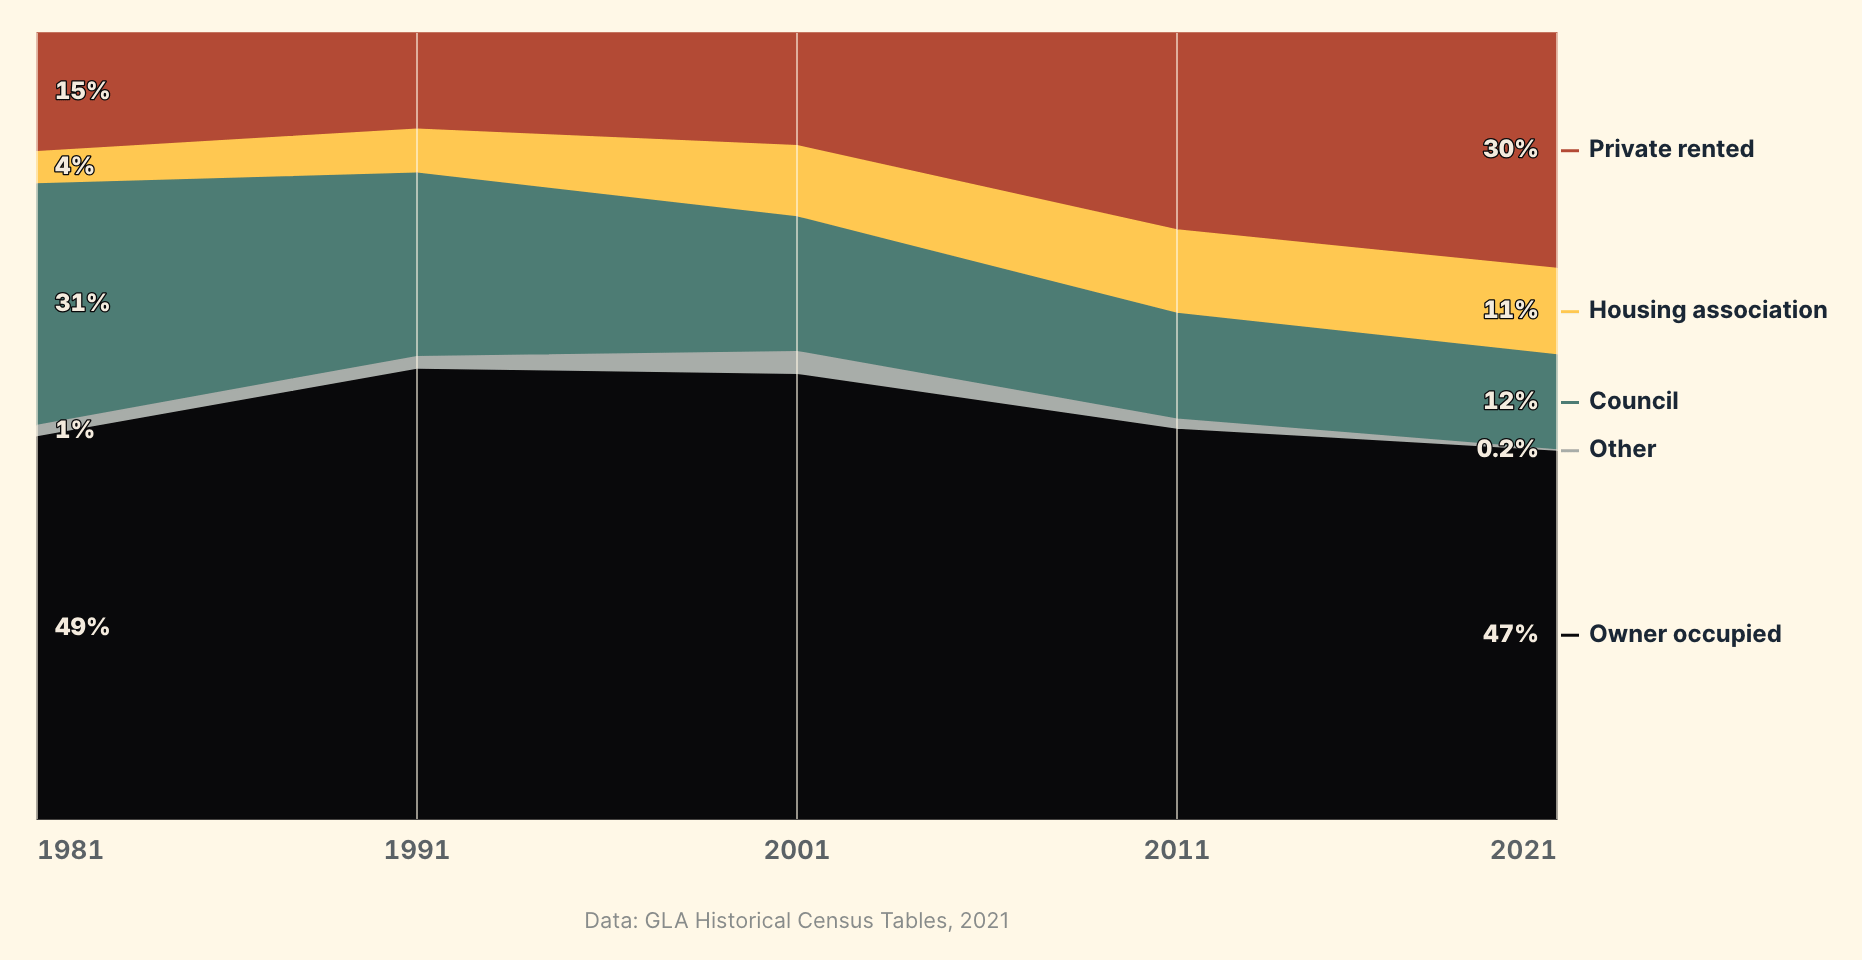
I also went back through historical census data to show how private renting overtook council housing. In 1981, 30.7% of London households rented from councils and 15.1% rented privately. By 2021, those figures were 12.1% and 30.0%.
You can see the whole London data project here.
The visualisation challenge is part of a bigger change I started making about a year ago. I decided it was time to spend my time a little more deliberately. Fewer short-lived ideas, more ambitious projects. Fewer clever social media posts, more volunteering.
One result is Deptford.org, my local history project. Over the past year, it has grown well beyond, well, local history. My wife and I have also continued picking litter in our local river. I’ve become more involved with Friends of Brookmill Park, organising public science talks and editing the group’s newsletter. I also started volunteering with Creekside Discovery Centre, helping lead walks on the bed of Deptford Creek at low tide. And this month I’m starting a master’s degree in digital journalism at Goldsmiths. I’m very curious to see where that leads.
Thanks for reading! If you enjoy the newsletter, share it with a friend or ten. And if you really enjoyed it, consider upgrading to a paid subscription to support my work.
Elia Kabanov is a London-based science writer exploring technology, cities, nature and history (@metkere).
Happy birthday from your newest reader!